Unit 5
How David Eaves teaches Unit 5 (part 2)

Data is Political
What is this page?
This is a detailed breakdown of how David Eaves, a Lecturer at the University College London's Institute for Innovation and Public Purpose (UCL IIPP), teaches the contents of Unit 5 of the open access syllabus developed by Teaching Public Service in the Digital Age. To read how part one of Unit 5 is taught, see here.
It is part of a series of twenty-five classes that David developed originally for the Harvard Kennedy School's master and executive education programs, where he taught for eight years, and are now taught at UCL's master and applied learning programs.
We believe presenting diverse ways to teach the syllabus will help others adopt and teach the material in a range of contexts. See here how Konstanz University's Prof Ines Mergel teaches the same unit.
Who is this page for?
This page was developed for university faculty who teach public administrators or master's levels students in public policy and public administration. This material may also be suitable for teaching to upper year undergraduates.
Class Overview
While a great deal of opportunity lies in governments' use of data to drive efficiencies and improve policy or services there are also significant risks - data can as easily be used for ill as for good. This class will first explore the different uses of data in governments and then explore ways in which data can explicitly or subtly cause governments to make choices that negatively impact those it serves. The goal is not to turn students into data experts, but rather make them realize what their responsibilities as public leaders are and which questions about the use of data they should be asking.
This Class' Learning Objectives
By the end of this class students should be able to:
Identify the types of problems that data can be used to solve
Recount some of the main ways and reasons that data is not successfully deployed
Determine the feasibility of using data science to address a problem facing government agencies
Identify the responsibilities in managing data
How this class relates to the Digital Era Competencies
💡 This class has a specific focus on Competency 7 - Data. See all eight competencies here.
Assigned Reading and Practical Resources
As they work through the readings in advance, students should have in mind the following questions to help them prepare for class:
The readings suggest that we already had a first data revolution in the 19th century. What new institutions and roles emerged from this first revolution? What positive and concerning lessons have we learned from the first data revolution?
In which ways has data collection changed the role and increased the power of the state? Which types of practices, rituals or frameworks could you incorporate to your team as a checks and balances mechanism to prevent increasing coercion power?
Core Reading (Required)
Seeing like a State (1999) [Part 1, Chapter 2, pp. 53-84], Book by James Scott
Without a critical approach to big data it risks becoming an increasingly sophisticated paradigm for coercion (2017), Blog Post by Hamish Robertson & Joanne Travaglia for the LSE Impact Blog
Advanced Reading (Optional)
Ideological Inheritances in the Data Revolution (2016), Blog Post by Hamish Robertson & Joanne Travaglia for the LSE Impact Blog
Lies, Damned Lies, and Open Data (2012), Article by David Eaves for Slate
Hacking, Glitches, Disinformation: Why Experts are Worried about the 2020 Census (2019), Article by Chris Hamby for The New York Times
How Data Does Political Things (2015), Blog Post by Jeffrey Alan Johnson for the LSE Impact Blog
Detailed Class Breakdown
Class plan: 75 minutes
See David's slides for this class.
The sections below describe the dynamics of each part of the class:
Segment 1 - Data for Decision Making – 25'
The goal of this section is to enable students to recognize patterns and understand the data cycle for decision making.
Purpose of this segment
Today, for most problems that public leaders face, data can provide relevant insights for decision making. One insight from Dr. Mashariki in the previous class is the value of recognizing patterns different types of data problem. Once a problem can be slotted into a familiar type an appropriately skilled team can leverage existing tools, skills and knowledge from unrelated work to help solve it. As a result building capacity around certain problem types can allow a team to scale its impact. This section introduces some of the most common patterns and opens a discussion about what to do with the increasingly lower quality data that is the result of cheaper and easier data collection and storage mechanisms.
Video of David teaching this segment
Examples and Discussion
In the previous class, guest lecturer Dr. Mashariki shared a list of the most common data analysis patterns he has experienced:

A slide titled 'Urban Data Science Patterns' that includes boxes for 'Targeting', 'Prioritize your backlog', 'Anomaly detection', 'Scenario analysis', 'Estimating your resources', 'Matching' and 'Something Else'.
At this point, instructors should share examples with students with the goal of highlighting that data analytics teams face challenges that require a variety of skills. In this class, drawing on Dr. Mashariki's experiences, David recounts two examples of problems that New York City was facing.
1) Illegal Grease Dumping: A small number of restaurants illegally disposed of hot grease down street drains. This grease would then congeal clogging the city's sewer and drainage systems when it rained. The challenge for the data team to help the city's inspection team better target the restaurants most likely to be involved in this illegal practice.
2) Optimizing Ambulance response Times: Earlier work had been done to pre-position ambulances around the city to minimize response times. The analytics team investigated asking "why are response times slower than expected?" This could have a meaningful impact. A average reduction in response time would could save the lives of New York residents.
After conducting ride-alongs the team realized that ambulatory teams work long shifts at odd hours. As a result they frequently abandon their assigned pre-positioned locations to buy food and coffee. This insight shifted the data problem to identifying the 24h coffee places in NY. By doing this, the teams could then reallocate the pre-positioned ambulance locations next to a 24 hour coffee location. This greatly reduced the likelihood that ambulance teams would abandon their post thereby ensuring they remained in an optimal location. This work ended up significantly reducing response times.
💡 Instructors should, when possible, find examples that will be engaging to their students. Try to find examples that map to patterns outlined by Dr. Mashariki above. At least one example should include the condition where the data analytics team had to "ground truth" or gain an insight not just from the data, but from following around those involved in the work (as in the ambulance example above).
After relating a few examples of how data can assist with decision-making, instructors can ask students to categorize the problems according to the patterns laid out in the table above. The key point of learning these patterns is that sometimes the problems changes but they still fall in the same category, so the team can invest resources in developing more internal skills and knowledge.
The second part of this section David connects the challenges of data analysis with the earlier class on Wardley Mapping in Unit 2. David outlines why managing data will continue to be challenging. Specifically he outlines he believes that whilst the world will acquire more high quality data in the absolute sense, that this will be dwarfed by a relative explosion in lower quality data.
In this world one of the key roles of public leaders will be to assess which data needs to be standardized and organized to become reliable and high quality and which data sets can remain lower quality but still allow the organization to meet its mission.

David shares a couple of examples of this dilemma, including one in the context of Covid-19 (see the video above at 16m 15ms).
Segment 2 - Data as Infrastructure – 10'
Purpose of this segment
The goal of this section is introduce the concept of data as infrastructure and to discuss some implications of standardization.
When policymakers think about the use of data, the most common assumed usage is to inform decision making. But data also serves numerous other purposes such as operations or tracking transactions. Data - and all the possible uses of it - is increasingly central to the effective function of any digital era organization (particularly governments!). As a result, it is essential that digital era public servants have models for how data might be managed, and an understanding of how sharing and integrating data across government departments could create new public goods. The purpose of this section is to explore these possibilities and discuss some of the barriers and consequences of data standardization and sharing.
Video of David teaching this segment
Discussion
Before discussing the implications of standardization, David likes to re-introduce the concept of shared government infrastructure as first touched upon in the Government as Platform class in Unit 2. He does this by showing a visual representation of how data can be an enabler of integration:
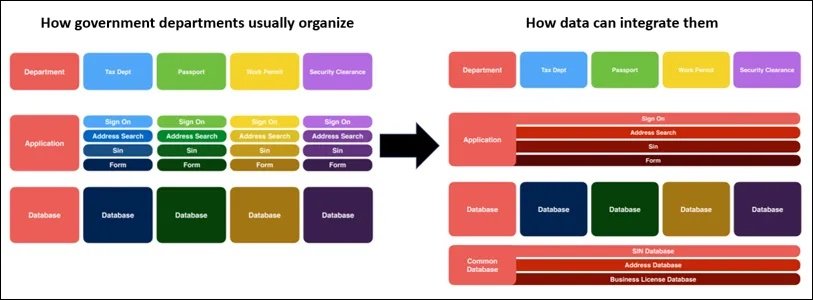
This image shows slides from the Unit 2 Government as a Platform class, showing the shift from data being managed vertically by each minister or agency to one where it is shared common resource across the enterprise.
David then discusses some examples governments that adopt this model of organizing and sharing data:
Estonia's X-Road as the canonical model for data as infrastructure
Open Concept Lab's Community-driven Terminology Management as an effort to create data standards
But if the benefits of data standardization and sharing seem clear, why are there so few examples of governments engaging in this practice? Instructors should pose the question to the class and look for examples from students' experiences. While there are a range of answers, instructors should highlight three key concepts:
There are risks to standardizing data before the risks associated with the data are understood or the various needs agencies have of the data are understood. For example establishing a standard for parcel address data that focuses on property ownership will make the data useful to some services - such as taxation - but less useful for others - such as mailing information to all eligible voters. (can you spot why? see below...)
There are often winners and losers in the process of standardizing, those whose needs are better or worse met. Even if there are increased benefits for more stakeholders across the enterprise, this dynamic can create opposition from specific and sometimes influential stakeholders. Picking up on the example above, standardization of land parcel data might make it useful to the tax authority (which only cares about who owns which parcels of lands) but only solve some of the problems faced by the election authority (which cares about how many different residences may exist at a single location, such as in a towerblock).
Data ownership is a form of power. Institutions can be concerned about losing control over "their" data. They may fear that others could analyze their data, exposing them to greater scrutiny. Or they may fear that decision makers, armed with data about their operations or work, won't feel the need to consult with them when making decisions that might impact them.
Segment 3 - Data is Political – 40'
The goal of this section is to identify the responsibilities of managing data in government agencies.
Purpose of this segment
The idea of using data to assist with decision making may seem like a step towards more objectivity in the process. However, the reality is that virtually all choices relating to data are political: what one opts to collect, picking the variables, the format and the questions to be answered are all political choices. This section discusses how working with data can be a practice fraught with challenges and biases, and what responsibilities derive from this fact.
Video of David teaching this segment
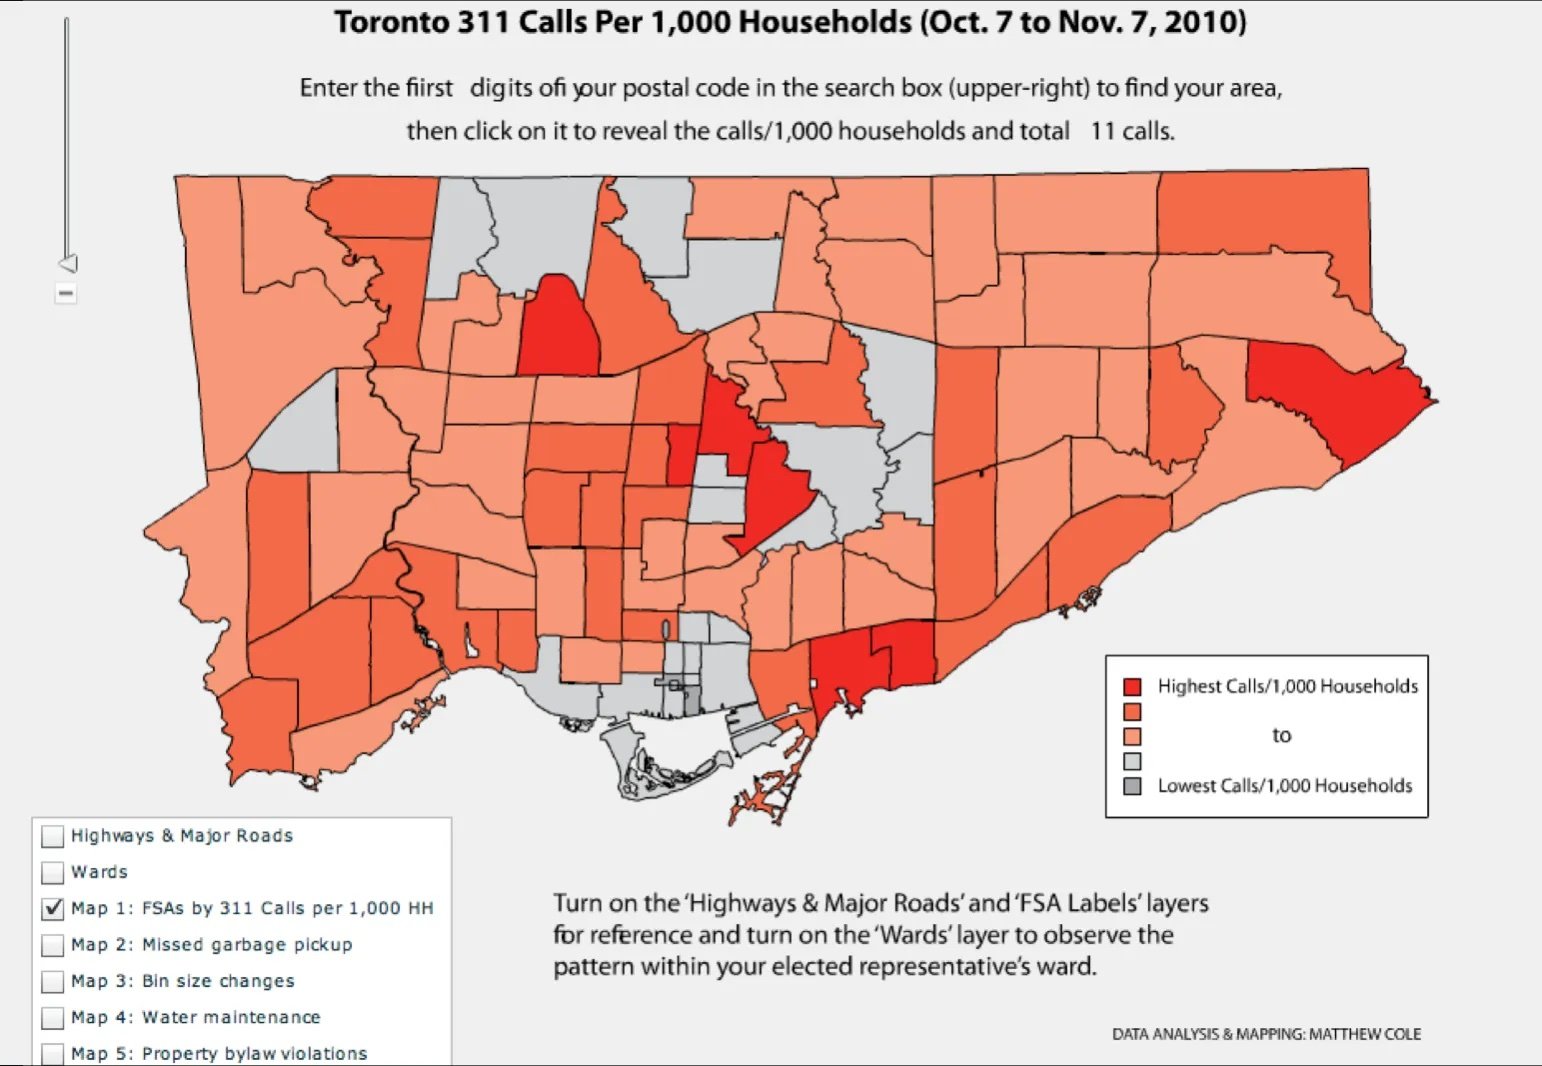
A heat map of Toronto showing 311 call volumes by district. Map by Matthew Cole.
Debrief
Students from every group will bring different views and instructors should look for responses that express concerns about the nature and the choice of the data. Some questions policymakers should ask are:
Is every citizen aware of the 311 number or are there local disparities in awareness and usage of the service? For example, there are often a small number of "power users" who see submitting 311 tickets via the city's smart phone apps as a form of civic duty. These users are not, however, representative.
If there are regional differences, what are the categories of citizens that tend to call more (eg wealth, age, etc.)? People in underserved neighborhoods may not call 311 on the belief that the city won't act on any problem. Some more elderly populations have been known to call 311 for a sense of connection and community. These differences are not a reflection of the number of challenges in those neighborhoods.
If the choice of data is biased, then what bad decisions can it lead to? How do we ensure political leaders are asking to collect data which will be useful in addressing a problem?
What data to focus on, the format and the questions asked can all be highly subjective choices. Working with data implies making definitions about problems or, more seriously, people. Deciding how to define groups has real and significant meaning with a long history of abuse - particularly by government. The core is to ensure students understand that once converted to "data" an issue becomes objective. Rather students have a real and serious responsibility to make sure they are ask the right questions to using processes that are inclusive as possible to help inform their collection and decision making process.
Data Driven Decision Making Cannot Escape Values
To drive home this point David show a map with an odd polygon placed over it and asks students what they think it represents.
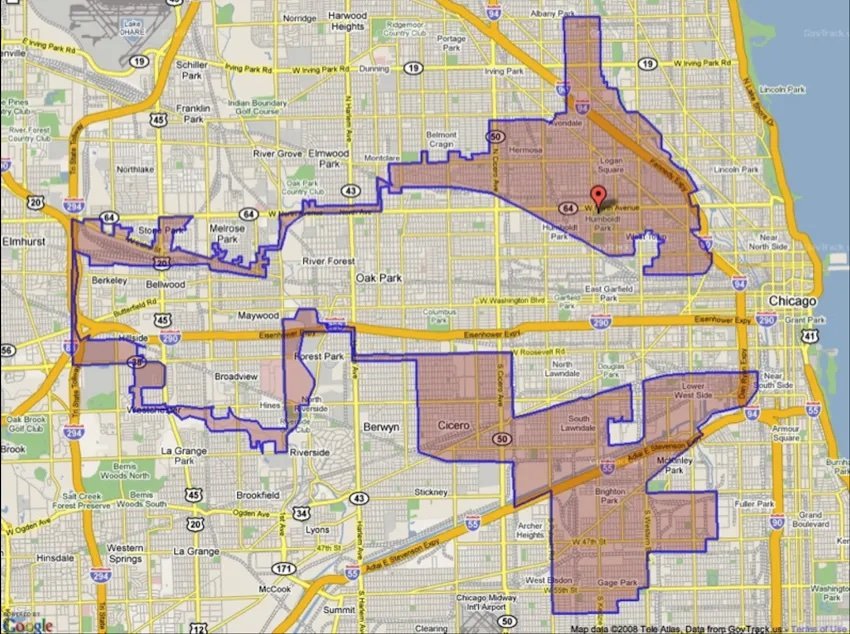
A map of a gerrymandered congressional district in Chicago.
The map is of a congressional district in Chicago that has been gerrymandered. David's point is that many of the elements of evidence based public policy are in play in the creation of this map. The decision makers had census data and evidence of under-representation. They then used that information to create a outcome.
The point is that values play a key role, even in the data-driven decision making. Policymakers must have clear which values guide them and inform their choices.
Reflections
As usual, David likes to finish the class with the main takeaways. Here, he highlights the following:
Decisions you make will affect how people are seen, defined and understood
Data alone is not sufficient to lead to good decisions
There are standard types of problems that can be solved
Relatively speaking, data is increasing in quantity, not in quality
Every policymaker has an ethical responsibility over the use of data
Discussion
In order to start the discussion, David touches on some exciting examples in which data predicts or solves tangible problems:
Google's use of transit data to enable journey planning, resulting from a user centric process that also involved a lot of positive cooperation with governments
A prediction model for when flu infection rates created by Google with obvious value to policy makers
A historical and famous map of London that connected geographical data on water sources and cholera deaths, which revolutionized ideas of public health and public infrastructure around the world
These and other engaging examples of public interest data use tend to make people optimistic about how data can improve decision making in governments. And while data does hold many opportunities it is critical that digital era public servants understand the limits of data, and the dangers of using it unquestionably. To illustrate, David runs an exercise.
Exercise
Students are shown a geographical map with the distribution of 311 calls (311 is the number to report non-urgent issues - like pot-holes - in many US cities). Then they are asked to imagine they are leading a data team in the city whose mayor gave them the task of reducing response time to solve 311's reported issues. Using Amen Ra's Urban Intelligence Ecosystem framework (below), he splits students into four groups, each responsible for brainstorming what problems can happen in each of the four phases: data collection, modeling, analysis and decision making.
Common questions from students faculty could prepare for:
-What is open data?
- What are the roles of a chief data officer?
- How do you decide which data you standardize or not?
How can you get support teaching this unit?
We're dedicated to helping make sure people feel comfortable teaching with these materials.
Send a message to mailbox@teachingpublicservice.digital if you want to book in a call or have any questions.
You can also connect with David on LinkedIn.
What are your rights to use this material?
We have developed these materials as open access teaching materials. We welcome and encourage your re-use of them, and we do not ask for payment. The materials are licensed under a Creative Commons Attribution 4.0 International License.
If you are using any of our syllabus materials, please credit us on your course website using the following text:
We are proud to use the Teaching Public Service in the Digital Age syllabus in our curriculum and teaching. Developed by an international community of more than 20 professors and practitioners, the syllabus is available open-source and free at www.teachingpublicservice.digital
Why was this page created?
This teaching material forms part of the Teaching Public Service in the Digital Age project. Read more about it here.
Acknowledgements
David Eaves would like to note that this material was made possible by numerous practitioners and other faculty who have generously shared stories, pedagogy and their practices. David is also grateful to the students of DPI 662 at the Harvard Kennedy School for enriching the course and providing consent to have the material and questions shared. Finally, an enormous thank you must be given to Beatriz Vasconcellos, who helped assemble and organize the content on this page.